
Step By Step Overview
1. The Vehicle Dashboard provides a dated snapshot of the fund so users can understand its current state from one page. The page displays fund performance, capital position, portfolio exposure, investor composition, accounting values, fee and carry status, and compliance reporting.
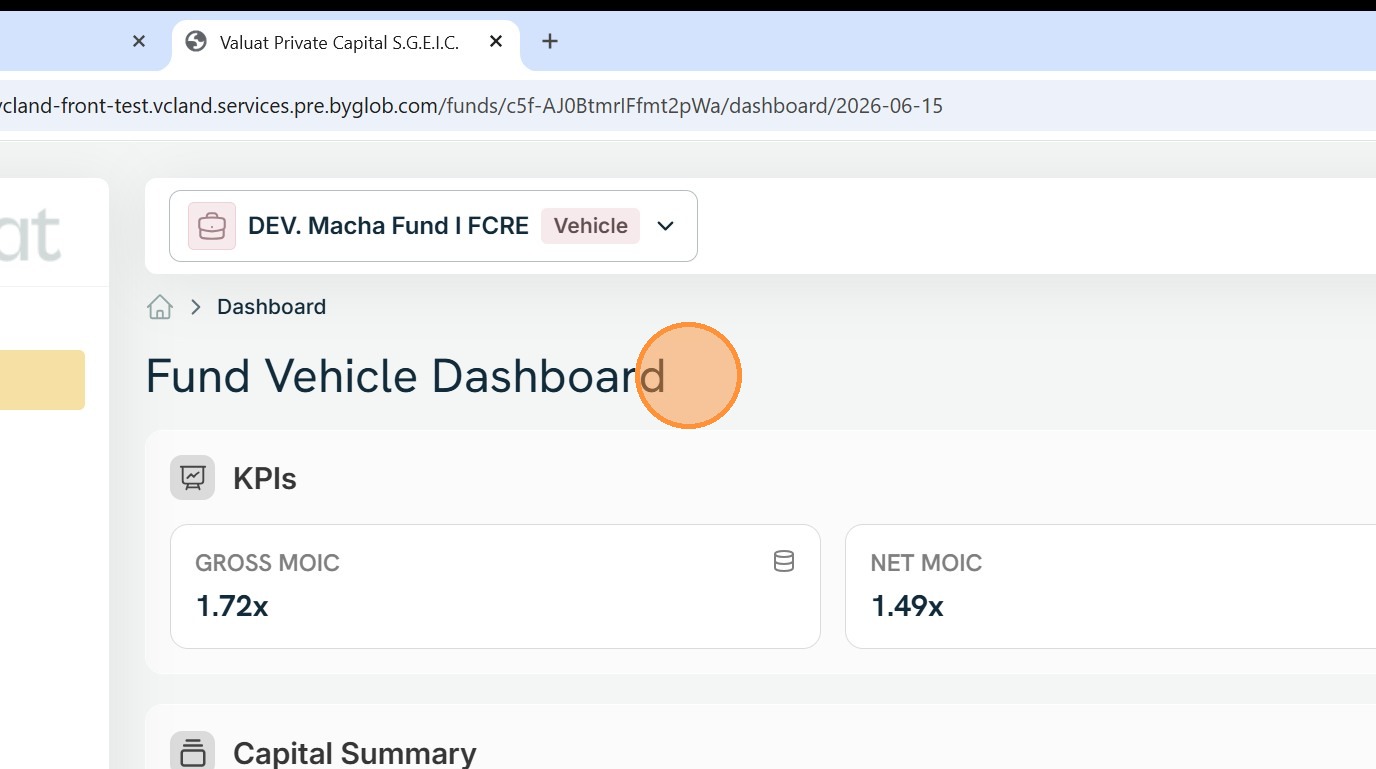
2. The header area shows the current fund context and an as-of date field, which defines the reporting date for the dashboard.
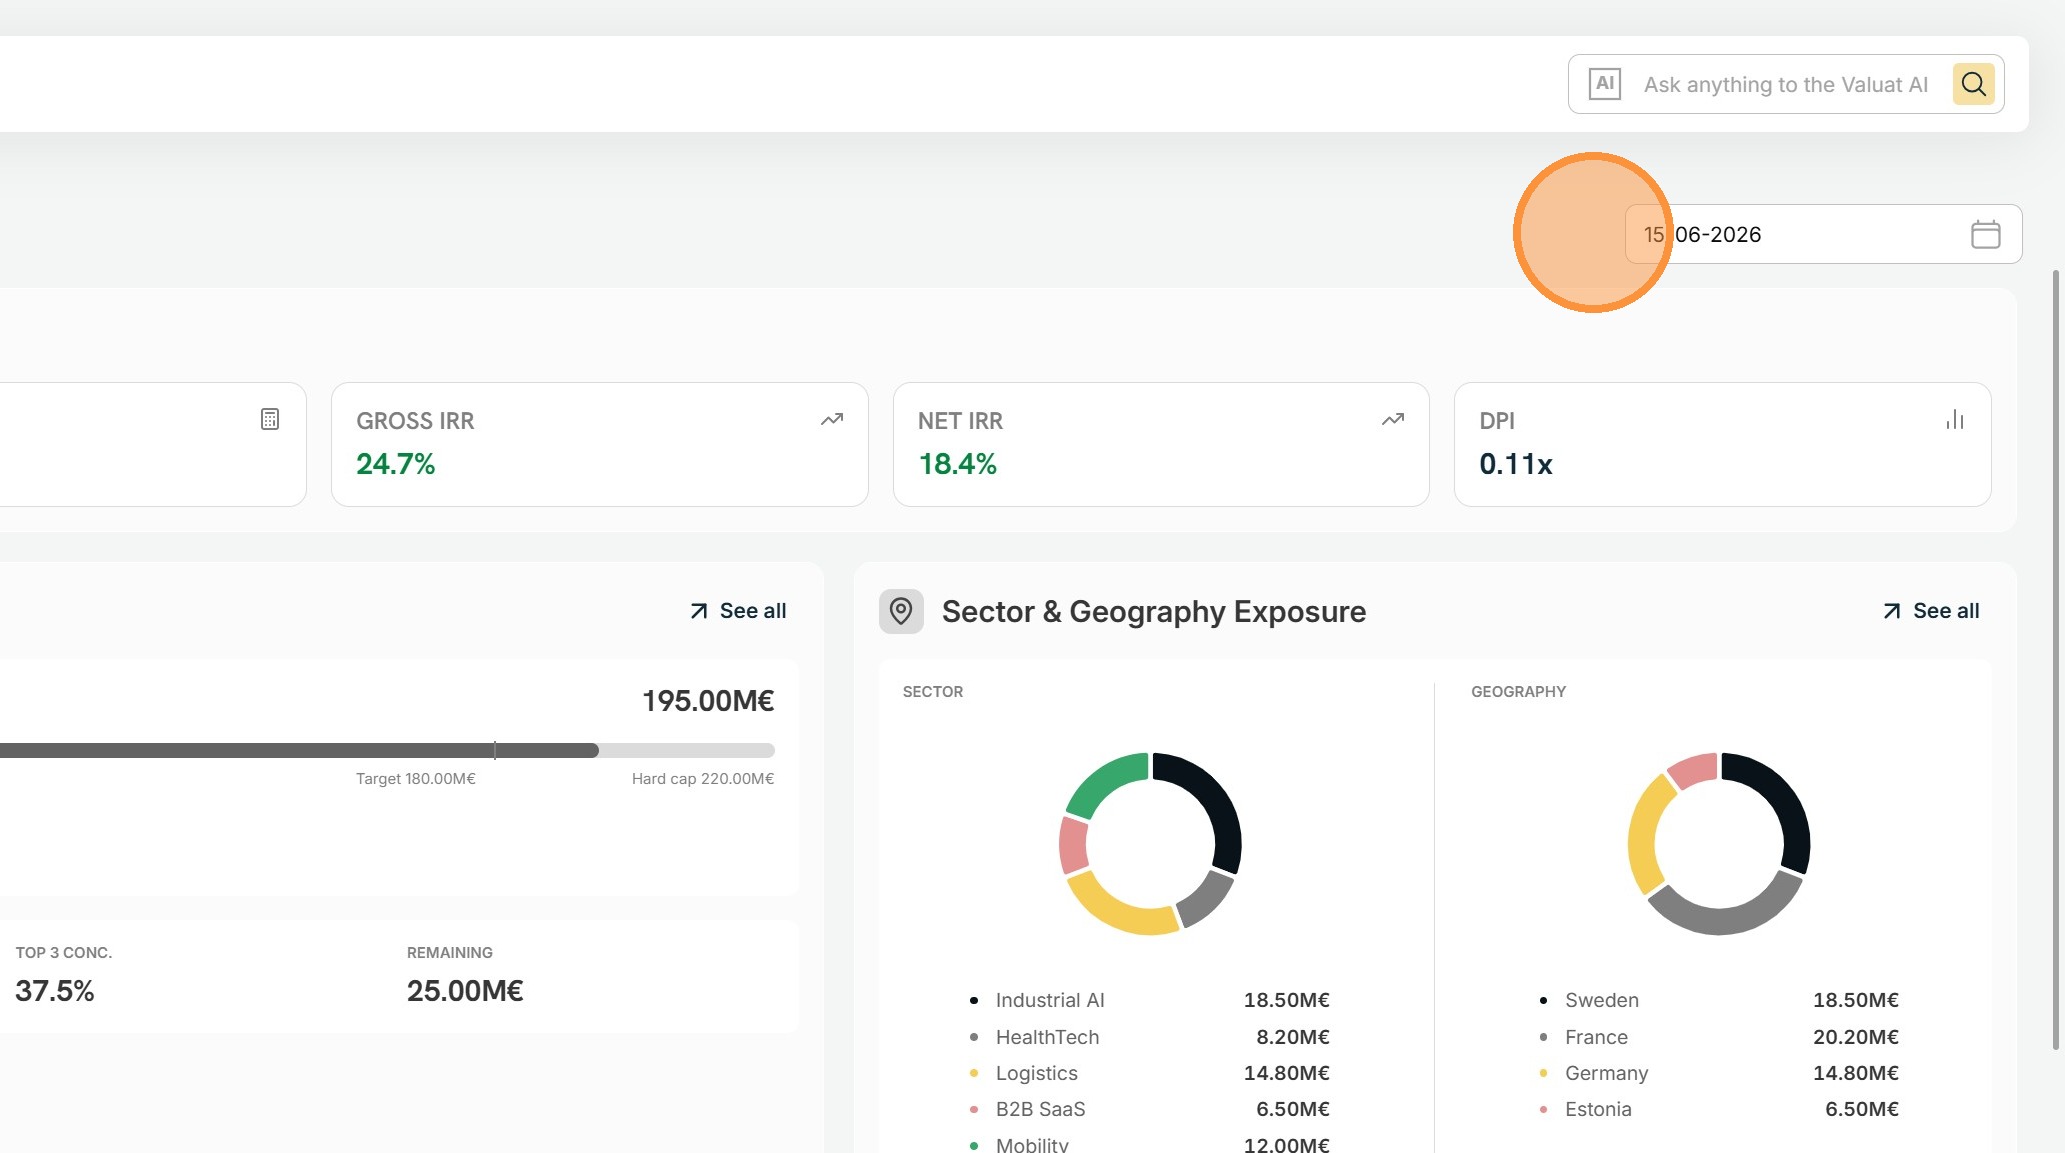
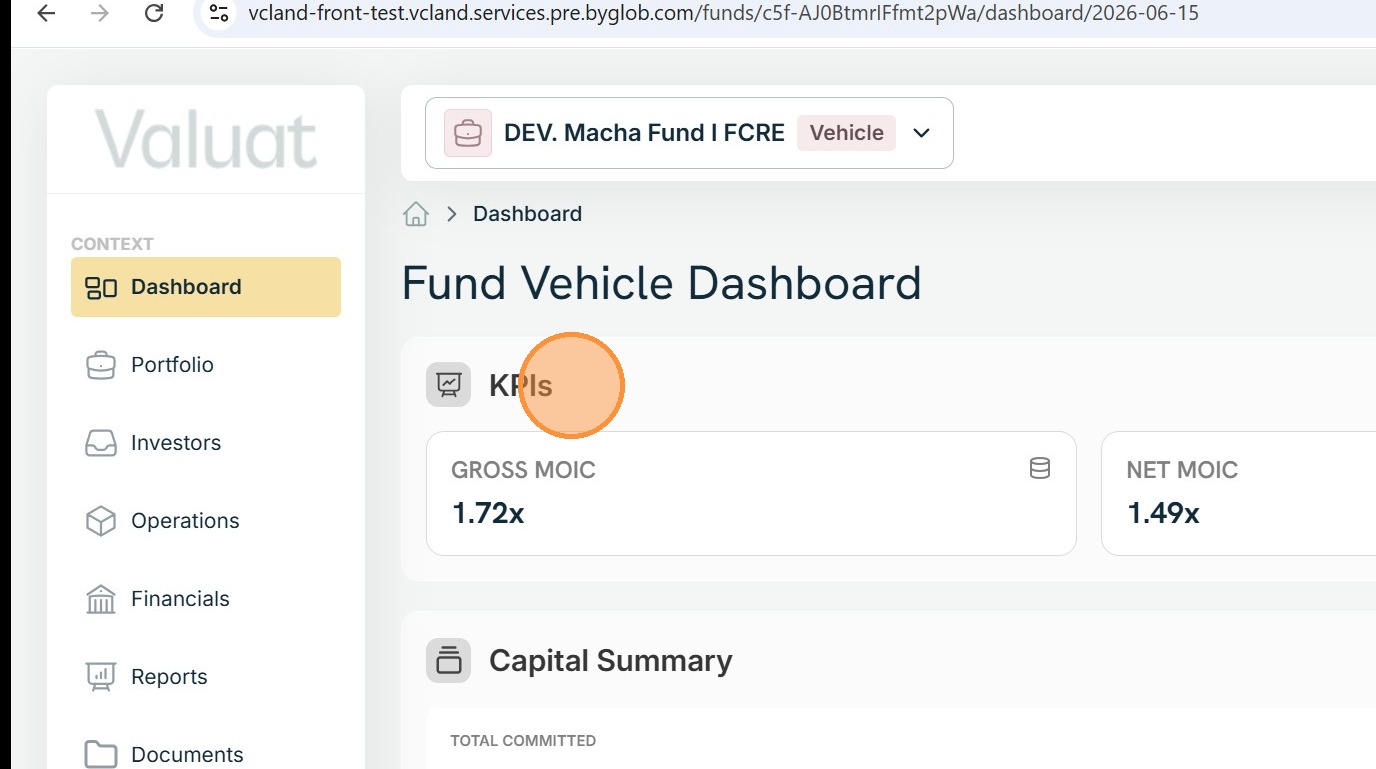
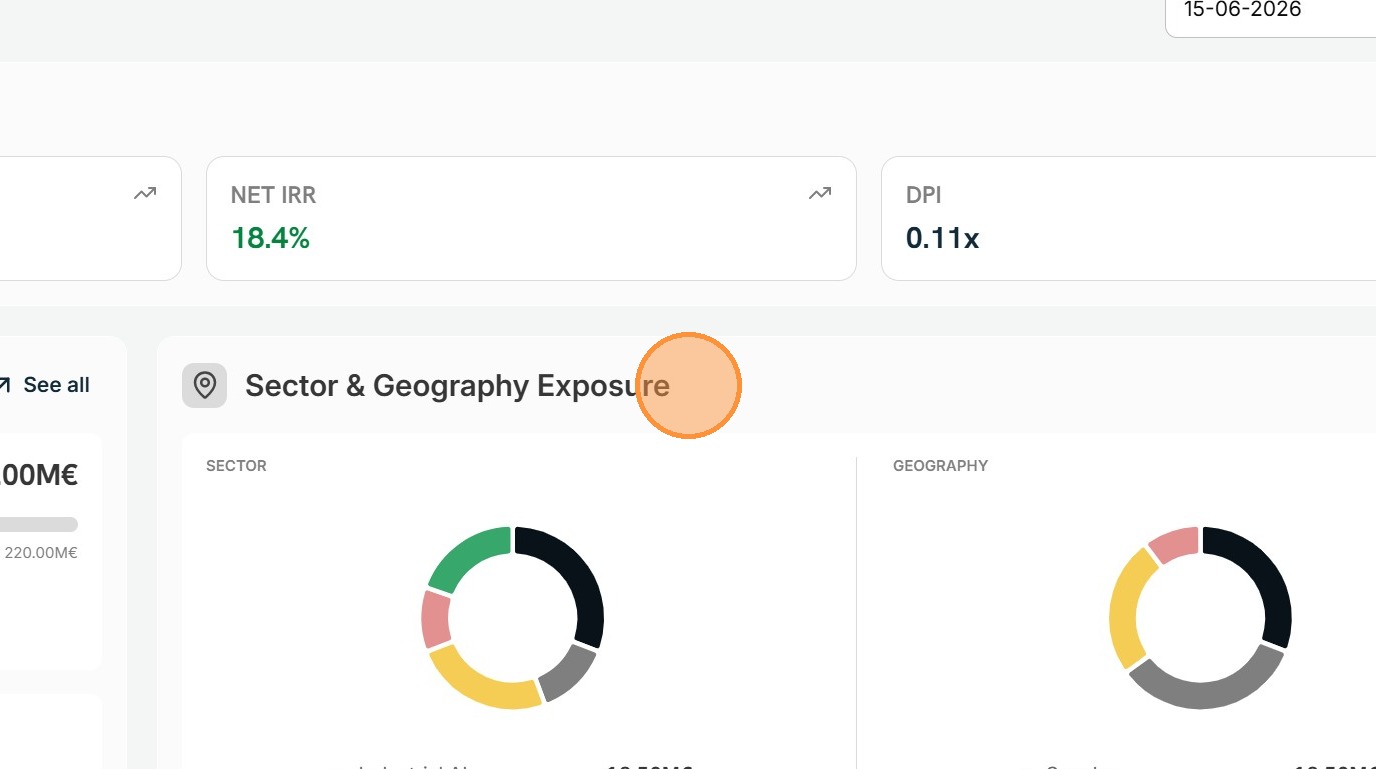
3. At the top of the dashboard, users see headline KPIs for Gross MOIC, Net MOIC, Gross IRR, Net IRR, and DPI. These metrics provide a quick performance read before users move into the more detailed sections below.
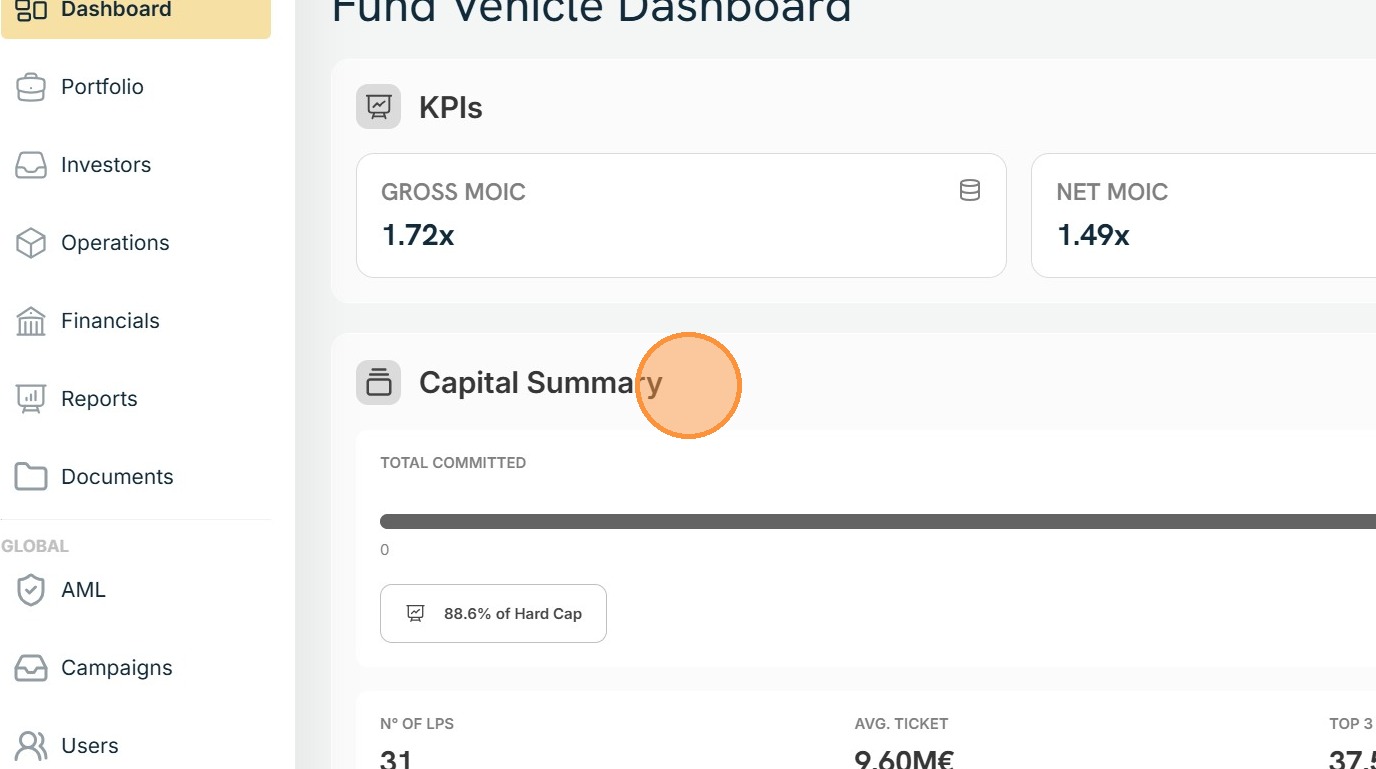
4. The Capital Summary summarises the core fundraising and investor-base metrics. Users can review total committed capital, target, hard cap, percentage of hard cap reached, number of LPs, average ticket, top 3 investor concentration, and remaining capital capacity.
5. The Sector and Geography Exposure area shows how the invested portfolio is distributed by sector and geography. It helps users understand concentration by industry theme and country exposure at a glance.
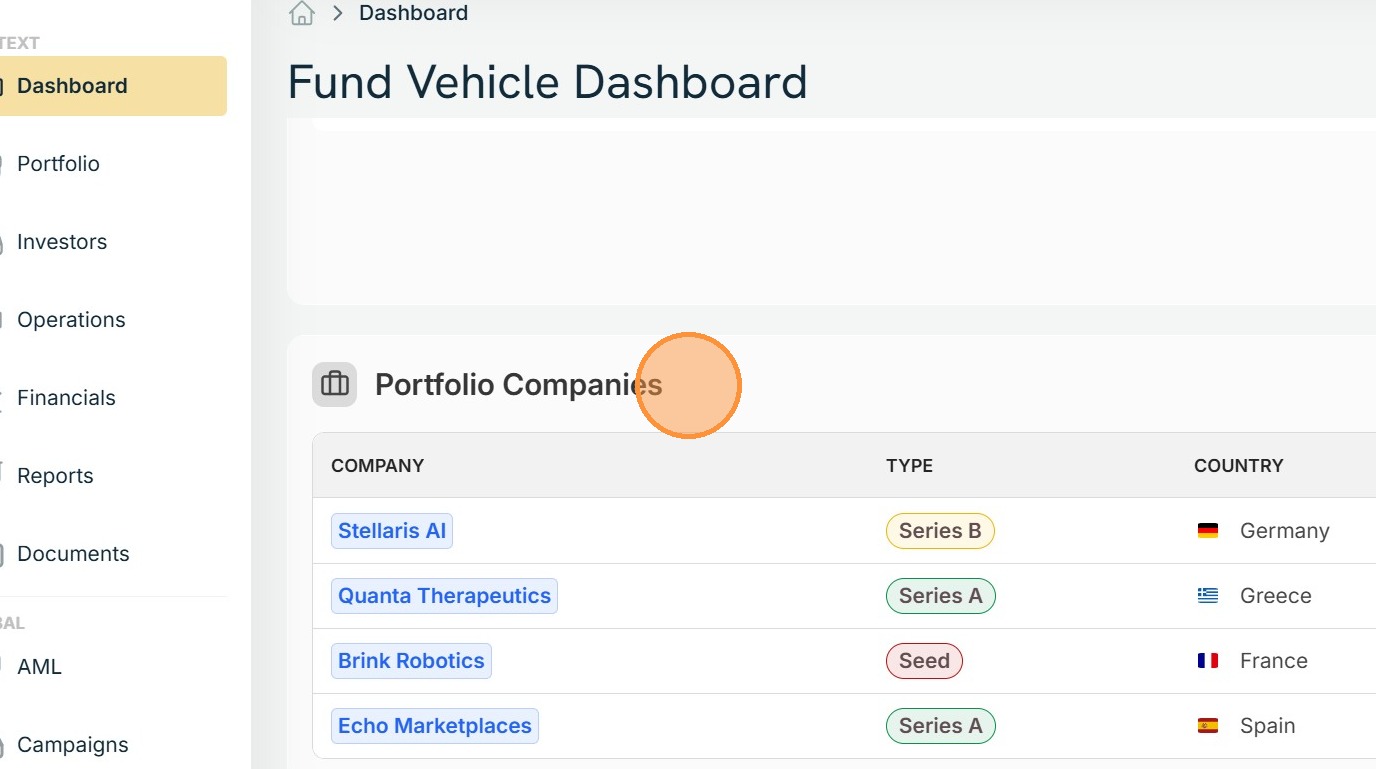
6. The Portfolio Companies section provides a table of portfolio companies and their current investment profile. Each row shows the company name, investment round or type, country, sector, investment date, invested amount, fair value, MOIC, and current status.
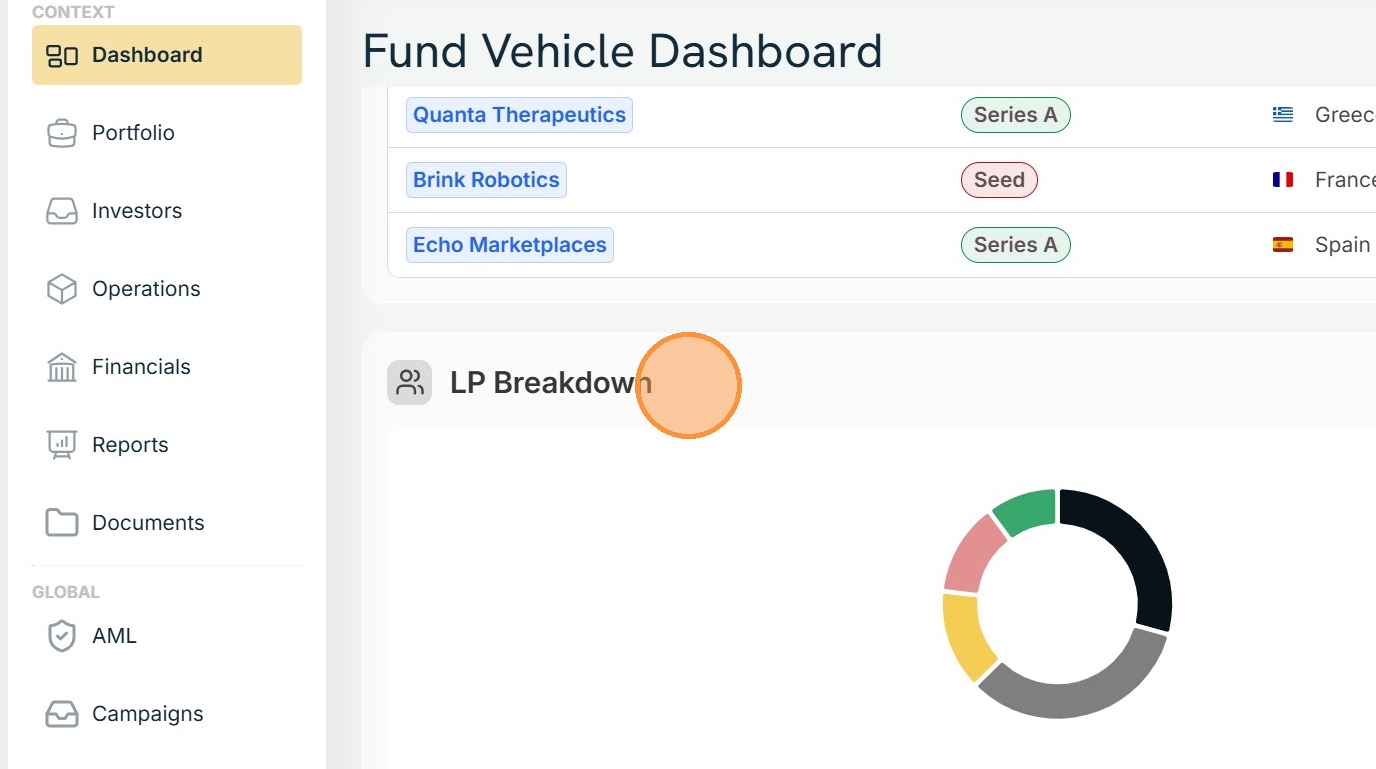
7. The LP Breakdown visual focuses on the composition of the investor base. It includes investor type distribution and a ranked list of top LPs by commitment, helping users understand concentration and investor mix.
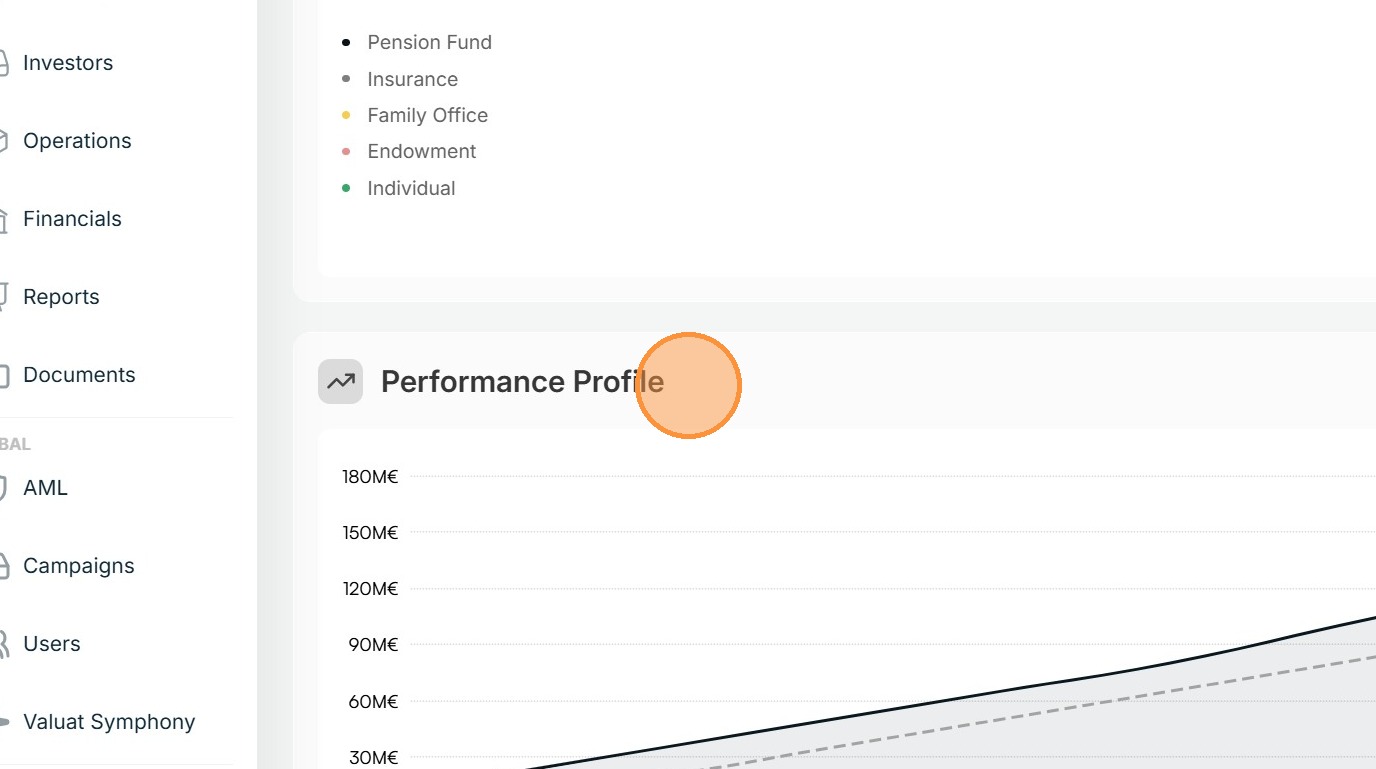
8. The Performance Profile chart presents time-series performance trendlines across reporting quarters. It visualises capital called, cumulative distributions, and unrealised NAV so users can assess how the fund has evolved over time.
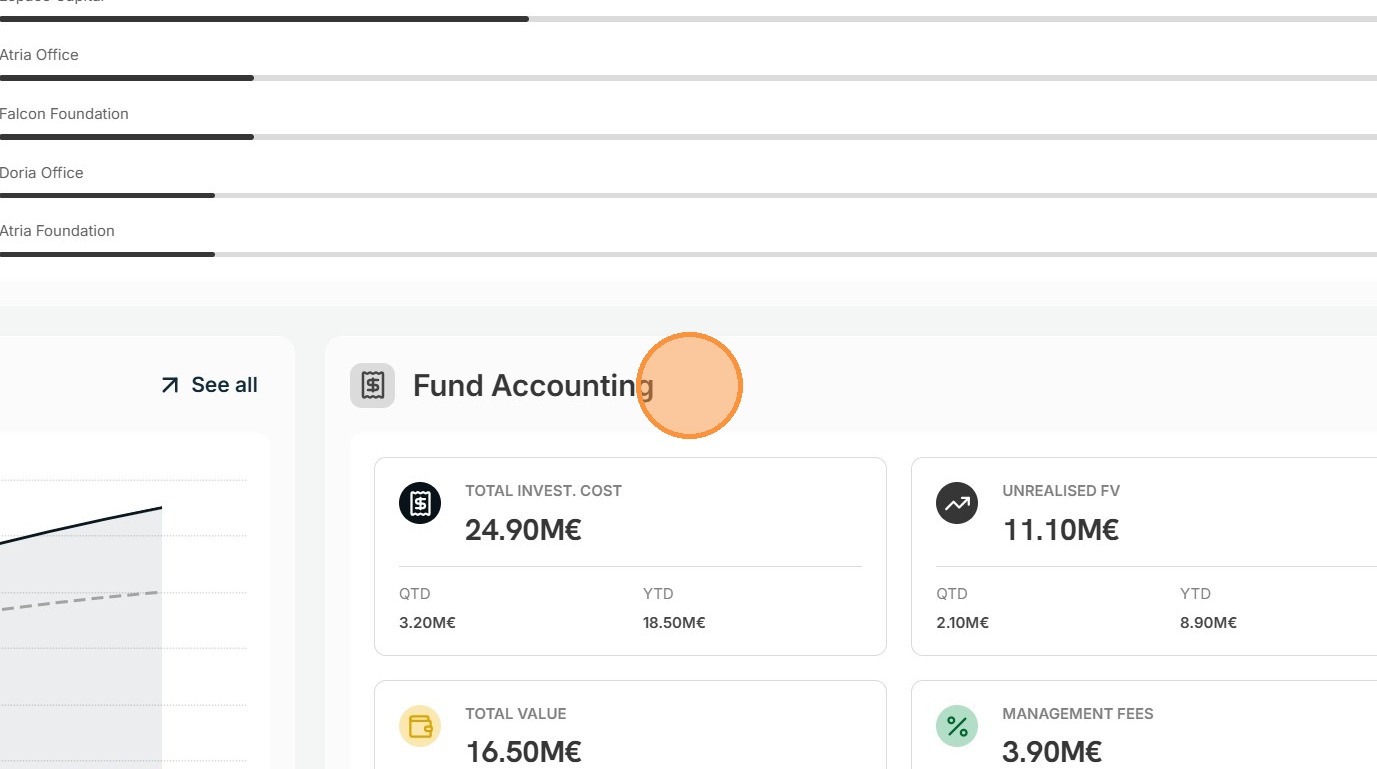
9. The Fund Accounting section summarises the accounting layer of the fund. Users can review total investment cost, unrealised fair value, realised proceeds, total value, management fees, other expenses, and NAV, each with QTD and YTD movement indicators.
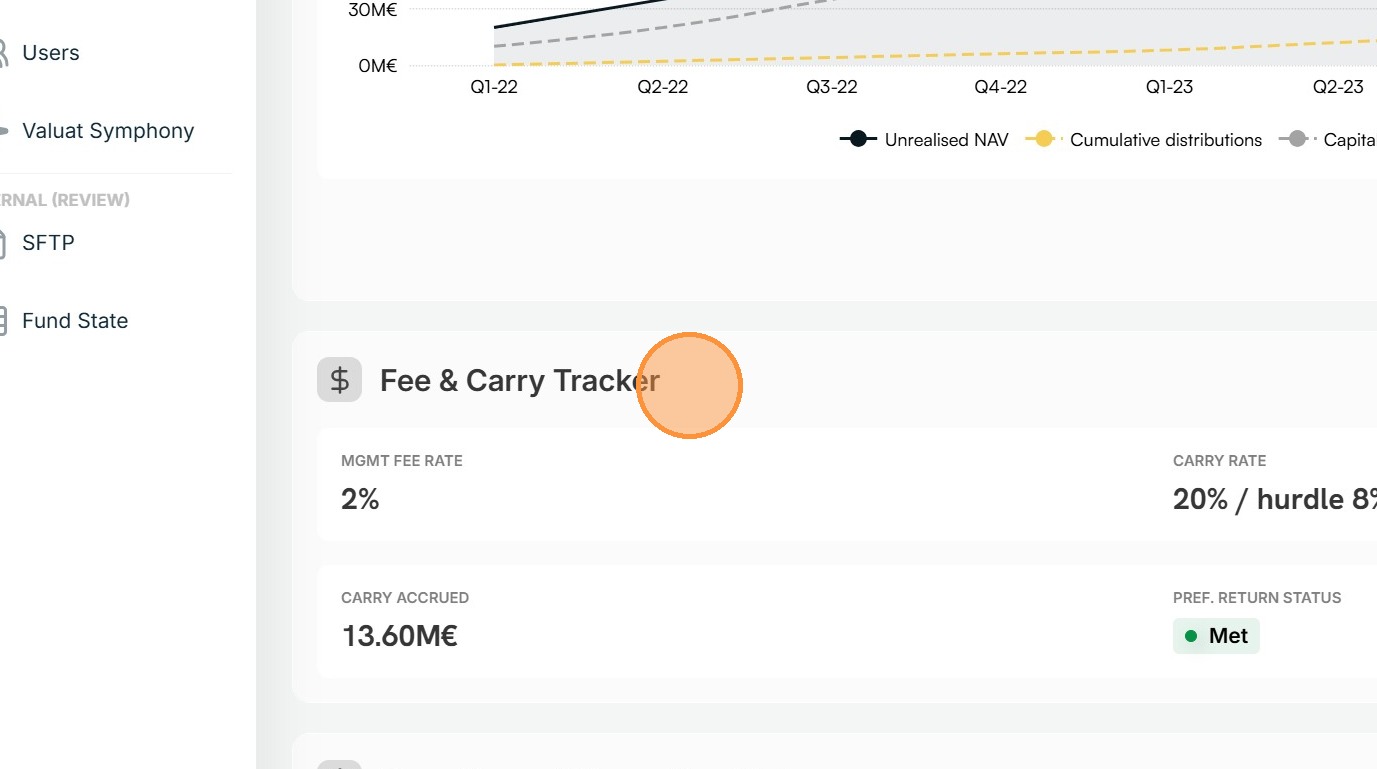
10. The Fee and Carry Tracker quadrant shows the current economics of the fund manager and carry structure. It includes management fee rate, carry terms, fees accrued and paid YTD, carry accrued, preferred return status, catch-up, and GP commitment.
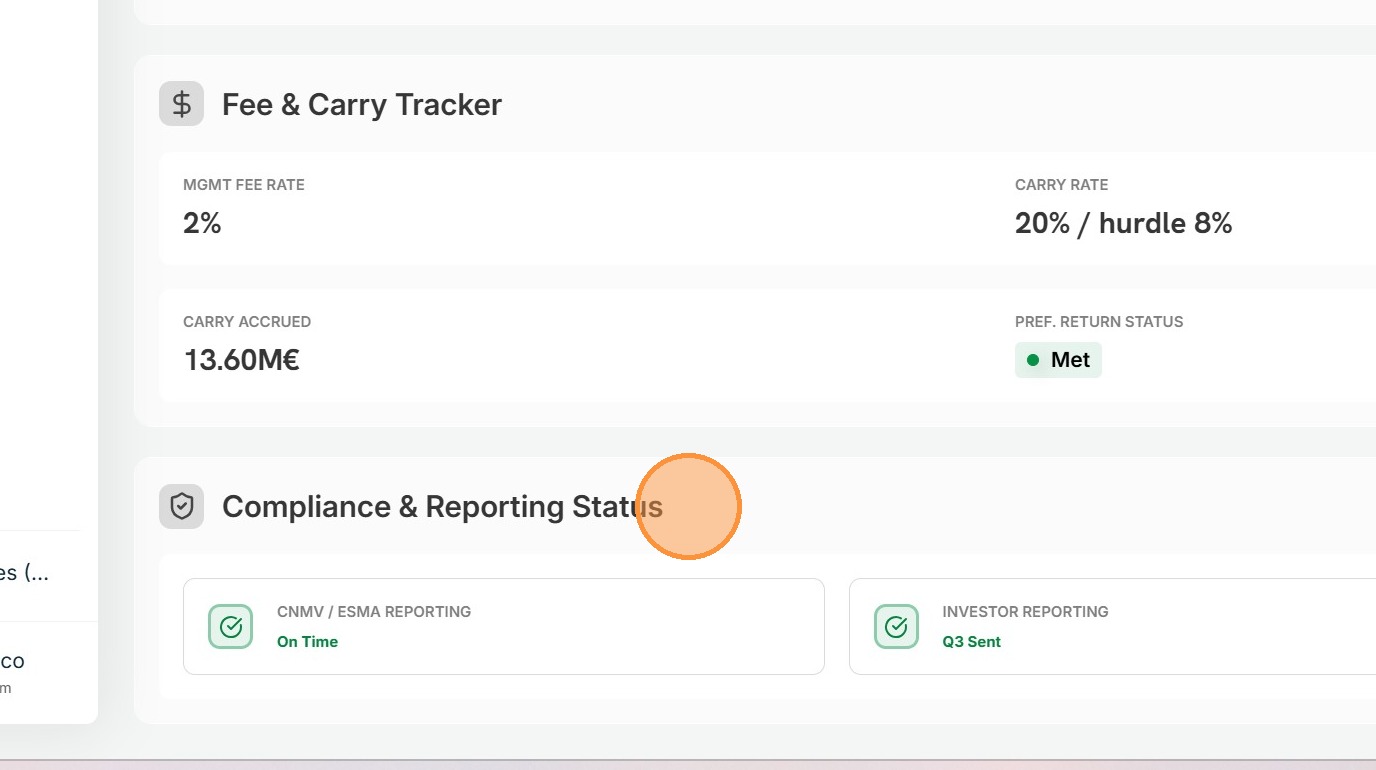
11. At the bottom of the page, the Compliance and Reporting Status shows the current reporting and compliance state of the fund. It includes CNMV / ESMA reporting, investor reporting, audited reports, AML/KYC fund-level review status, and ESG classification.
12. What users can do
Users can use the Vehicle Dashboard to assess overall fund health without opening multiple underlying pages. It is the fastest way to review performance, fundraising progress, portfolio exposure, accounting values, and reporting status together.
Users can use the as-of date to interpret the dashboard as a reporting snapshot rather than a live operational feed. This is important when validating figures against reports or when comparing the fund across multiple dates.
Users can use the See all links in sections such as Capital Summary, Sector and Geography Exposure, Portfolio Companies, LP Breakdown, Performance Profile, Fund Accounting, Fee and Carry Tracker, and Compliance and Reporting Status to move into more detailed views where available.
Users can also switch to other fund-level tabs such as Portfolio, Investors, Operations, Financials, Reports, and Documents when they need to investigate the source data behind a metric or follow up on a specific issue.
13. Tips for users
- Start on this page when you need a complete fund-level read before investigating individual records or transactions.
- Check the reporting date first so you know exactly which snapshot the KPIs and balances refer to.
- Use the KPI section for a quick return summary, then validate the drivers in Portfolio Companies, Fund Accounting, and Performance Profile.
- Use Capital Summary and LP Breakdown together when assessing fundraising progress and concentration risk.
- Use Sector and Geography Exposure to identify thematic or regional concentration before moving into the Portfolio view.
- Check Compliance and Reporting Status before preparing investor communications or regulatory reporting packs.
- Use the See all links when a summary figure raises a question that requires entity-level detail.